Previous Research (teraherrtz spectroscopy)
- Non-invasive mail inspection by terahertz wave
- Terahertz spectroscopic images of cancer tissues analised by chemometrics technique
- Gas phase spectroscopy by teraherrtz time-domain spectrometer: measurement of pressure broadening parameter of water vapor
- Terahertz pulsed imaging of frozen biological tissues
1.Non-invasive mail inspection by terahertz wave
Introduction
Due to the recent development in the generation and detection techniques for terahertz (THz) electromagnetic waves, various applications using THz waves have been proposed. The THz radiation lies approximately in the frequency range from 0.1 to 10 THz (wavelength from 3 mm to 30 mm) and shows properties of both radio waves and optical light. Because of its longer wavelength, THz waves are less scattered by soft materials such as paper, wood and plastics, and can create images of the objects packed in those materials. On the other hand, many materials show particular absorption spectra in the THz region, which can be used for their identification. Therefore, THz waves are a good inspection and identification tool for materials concealed in envelopes, plastic bags and cardboard boxes.Security and safety related applications are strongly required because of the recent social and political situation in the world. One of such applications is the inspection and detection of illicit drugs and hazardous materials inside mail. In Japan, the inspection of private mails is restricted by law and non-invasive inspection such as X-ray imaging and dogs are used for detecting hidden drugs. However, X-ray cannot identify the materials and dogs can smell only when the vapor of drug is leaking from the package. In 2003 Kawase et al. found that the THz wave can be used for the identification of materials in the envelopes without opening the package. Since then, many applications for security and safety have been developed with THz waves.
Mail inspection system using terahertz wave
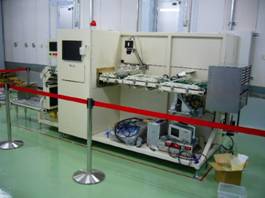
Our project aims at inspecting all mail handled in the Japanese international post offices, that is, more than 100,000 postal materials a day. However, taking in account the speed limits of the THz spectrometer, it is impossible to measure the spectra of all of them. To achieve, however, a complete inspection, the process was segmented into two stages; the first stage makes a rapid screening and the second stage identifies the substances in the mail selected as suspicious in the first stage. For rapid screening, we detect the scattering of the THz waves from powders, as the THz waves are intensely scattered when the particle size is comparable to the wavelength.The THz absorption spectra of the suspicious mail selected by the rapid screening system were measured with a terahertz time-domain spectrometer (THz-TDS). THz-TDS is a recently developed spectroscopic technique available for the THz region, which uses a femtosecond pulse laser for the generation and the detection of THz waves. Since the THz-TDS directly measures the electric field of the THz waves with short laser pulses, the system is less affected by thermal noise at 300K and achieves high sensitivity without liquid He cooling. Therefore, the THz-TDS is the most appropriate spectrometer in this region, also for use outside the laboratory.
 |
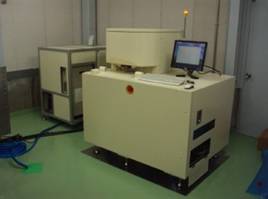 |
| Mail inspection system: First screening stage (left) and THz spectrometer (right) | |
 |
|
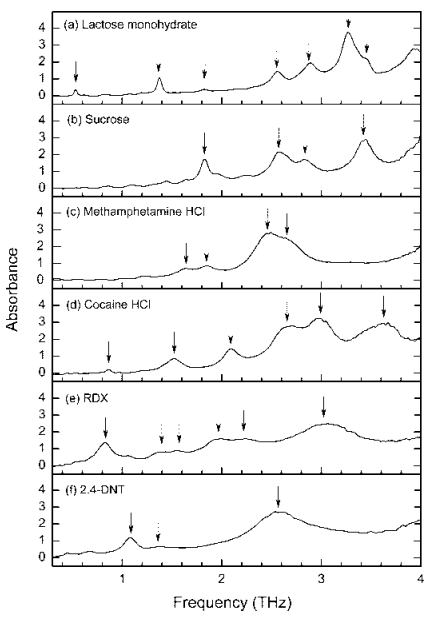
| Terahertz absorption spectra: (lactose, sucrose, methanphetamine, cocaine,RDX, and DNT) | |
Paper
- Hiromichi Hoshina, Yoshiaki Sasaki, Aya Hayashi, Chiko Otani and Kodo Kawase "Noninvasive Mail Inspection System with Terahertz Radiation" Applied Spectroscopy, 63(1), 81-86 (2009)
2. Terahertz spectroscopic images of cancer tissues analised by chemometrics technique
Introduction
By virtue of the penetrative property and the fingerprint spectrum, THz wave have been spotlighted in the various application fields. In the medical field, the difference of absorbance between cancer and normal tissue was found, and the potential of the THz imaging for the pathologic diagnosis has been expected. However, the absorption spectra of the cancer tissue show no remarkable structure, and show different patterns with the individual disease types. Thus the THz imaging can not be applied for the cancer diagnosis straightforwardly. In this paper, the Chemometrics technique (partial component analysis and cluster analysis) have been introduced for the systematic analysis of the THz spectroscopic images of the plural tumor samples.Terahertz imaging diagnostics of the cancer tissues with chemometrics technique
Four slices of the paraffin embedded liver cancer tissues were prepared without staining. The absorbance and the refractive index spectra were measured with a time domain spectrometer (Tochigi Nikon co.) in transmission alignment. The spectra were measured from 0.50 to 2.25 THz in frequency resolution of 25 GHz. The sample chamber of the spectrometer was purged with nitrogen gas in order to prevent the absorption of the water vapor in the air. The imaging spectra were obtained by moving samples in 0.25 mm step. The measurement took about 7 hours for each sample, composed of about 10,000 pixels.The first column of the figure shows the photo images of the samples. The red marked area gives the cancer tissues which were previously identified with the pathological diagnostics. The second and the third column show the THz images of the absorbance and the refractive index taken at 1.7 THz, respectively. As shown in the figure, the cancer tissues can be recognized on the THz images A~C. However, due to the variety of the tissues the correspondence between the cancer spots and the spots on the THz image is on a case-by-case basis. For example, the cancer spots can be well recognized on the absorbance images of the samples A and C, but on the other hand those are seen on the refractive index images of the sample B.
In order to extract the cancer information systematically out of the imaging spectrum, the principal component analysis (PCA) and the clustering analysis were applied. With the use of PCA, both the absorbance and the refractive index spectra were transformed to the low dimensional components which were set to represent the data in the largest variance. The imaging spectra were depicted in the principal components space, in which the cancer tissues can be well recognized as clusters of the data points. We applied the agglomerative hierarchical clustering (Ward’s technique) to the points on the principal components. The fourth and fifth column of figure shows the result of the clustering. The colored area of the sample A~C are in good agreement with the area of the cancer tumor.
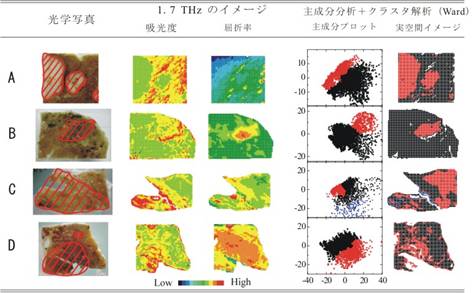 |
| The photo images, the THz images (in absorbance and refractive index) and the results of the Chemometrics of the paraffin embedded cancer tissues. |
Paper
- S. Nakajima, H. Hoshina, M. Yamashita, C. Otani, N. Miyoshi "Terahertz imaging diagnostics of the cancer tissues with Chemometrics technique" Applied Physics Letters, 90, 041102 (2007)
3. Gas phase spectroscopy by teraherrtz time-domain spectrometer: measurement of pressure broadening parameter of water vapor
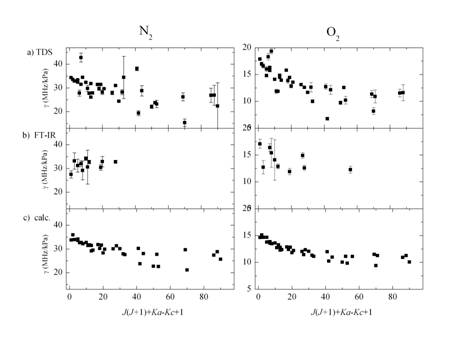
The development of femtosecond lasers has led to the time-domain spectrometer (TDS) becoming a widespread spectrometry tool in the THz region. Since a THz-TDS system detects signals with femtosecond time window and is less affected by thermal noise, it works without liquid helium cooling and enables relatively easy experiments in THz. In addition, the detector has a better signal-to-noise ratio and a higher dynamic range (10^6 ~10^8) than conventional Fourier transform infrared spectrometers (FT-IR) in the 0.3-4.0 THz frequency region, because the THz-TDS system is more stable than the combination of a mercury lamp and a Si bolometer. Due to these advantages, THz-TDS has been recently used for various spectroscopic studies in the THz region.In this study, we have built a THz-TDS for gas phase spectroscopy. Since long optical path is required for the measurement of absorption spectrum of gas phase molecules, a White-type multi-pass cell with a path-length of 2 m was combined with a conventional THz-TDS in the frequency region of 0.5-3.5 THz. With this system, we have measured the pressure broadening parameters of water vapor with N2 and O2 gas. Due to better signal-to-noise ratio of this system, the parameters of more than 30 lines were obtained for each gas, and their precision was much better than that of conventional results by FT-IR. The obtained parameters were compared with the theoretical values, and the quantum number dependence of the obtained parameters was observed for the first time.
 |
Paper
- Hiromichi Hoshina, Takamasa Seta, Toshiyuki Iwamoto, Yasuko Kasai, Iwao Hosako, and Chiko Otani "Measurement of Precise Pressure Broadening Parameters of Water Vapor with a Terahertz Time Domain Spectrometer" Journal of Quantitative Spectroscopy and Radiative Transfer 109, 2303-2314 (2008)
4.Terahertz pulsed imaging of frozen biological tissues
Introduction
With the development of technology for generating and detecting terahertz (THz) waves, various applications have been proposed in the last decade. The penetrability and appropriate spatial resolution of THz radiation enables perspective imaging, and the fingerprint spectra in this frequency region can be used for chemical identification. This technology has useful applications for imaging in the medical field since different tissues have different optical properties, such as absorbance, refractive index, and reflectance2-6. However, the water strongly absorbs THz radiation (as much as ~300–1000 dB/cm), allowing only a very weak THz transmission signal6. Only reflection-type imaging techniques succeed in observing tumors in vivo at the surface of the skin.THz imaging of frozen poke meat
In this study, the sample was frozen and the THz transmission spectra could be measured without absorption of radiation by liquid water. Sliced porcine tissue was used as a sample. (Figure1.) The windows were attached to a copper cell and cooled to –33 °C by the circulation of a coolant, and the temperature of the cell was monitored using a thermocouple. The cell was installed at the focal point of a commercial THz time-domain spectrometer (THz-TDS) (Aispec: pulse IRS-2300). The position of the cell was moved by a two-axis mechanical stage to a position 200 m away, and the imaging spectra for 100×100 pixels (20 mm×20 mm) were recorded in 7 h. The spot size of the THz beam was about 1 mm full width at half maximum at 1.0 THz. The optical path of the THz wave was purged by nitrogen gas in order to remove water vapor.Using the obtained spectra, the two-dimensional spectroscopic image of the sample was created. In the measurement, the cell was moved to a position 200 (micro)m away, and the imaging spectra for 100×100 pixels (20 mm×20 mm) were recorded in 7 h. Figure (center) shows the two-dimensional plot of the absorbance at 1.0 THz. The small spots of adipose tissue distributed in the striated muscle appear in good contrast as dark areas. However, this contrast does not reflect the difference in the absorbance but the decrease in the THz pulse intensity at the interface of different kind of tissues. To over this problem and achieve a clear distinction between tissues, the position of the peak maximum in the THz time-domain waveform was used for the mapping showed in the figure (right). Since the THz peak position at the interface lay between those of the 2 tissues, the position of the peak maximum changed continuously, and the tissues could be clearly distinguished. On the other hand, the small spots of the adipose tissues in the striated muscle were not clearly visible.
 |
 |
 |
| Picture (left) and THz absorbance image (middle) and THz pulse peak image (right) of frozen pork meat. | ||
Paper
- Hiromichi Hoshina, Aya Hayashi, Norio Miyoshi, Fumiaki Miyamaru and Chiko Otani "Terahertz pulsed imaging of frozen biological tissues" Applied Physics Letters, 94, 123901 (2009)