Spectroscopic study of macromolecules in terahertz frequency region
Introduction
Recent rapid development of spectroscopic techniques in terahertz (THz) frequency region enables measurement of low-frequency molecular vibrations much easier. Since the origin of those spectra is skeletal motions coupled with intermolecular vibrations, information about intermolecular interactions, such as hydrogen bonding, can be effectively probed by the THz spectra. THz spectroscopy may help to understand conformational change of large molecules such as proteins, DNAs and polymers, because higher order conformations of those molecules are constructed by the hydrogen bonds. However, the assignment of the THz spectra of such large molecules is still in its infancy. Anharmonicity of the potential and large amplitude of vibrational motion make the ab-initio calculations difficult. Additional spectroscopic evidences, such as polarization spectra which determine the orientation of vibrational dipole moments, may also help the assignment.Molecular vibrational spectra in THz region shows information as follows.
- In the infrared spectra, we observe vibrational modes of molecular functional
groups, but the energy of the THz photon is 2 order lower than IR. Therefore,
we observe more slower vibrations of weakly bonded heavy mass. In the spectra
of organic molecules, we mainly observe the vibration of hydrogen bonds.
The spectra highly depend on the crystal structures. The figure below shows
the spectra of sucrose taking different crystal structure. The difference
of the crystal structure is clearly seen in the spectra.
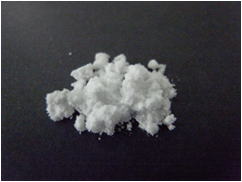
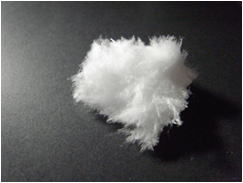
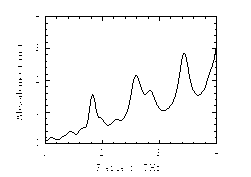
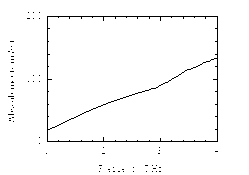
THz spectrum of crystal sucrose (powder sugar) THz spectrum of glass sucrose (cotton candy)
- The assignment of THz vibrational spectra requires complete information of the crystal structure. The assignment is not straightforward. We have to use DFT calculation including periodic boundary condition of crystal structure, which needs a lot of computational power.
- The linewidths of THz vibrational peaks are broad (typically more than 0.1THz) and overlapped. To reduce homogeneous and inhomogeneous broadening, its better to measure sample under low temperature.
Terahertz spectroscopy of PHB
In my present work, polarization and temperature dependent terahertz absorption spectra of poly(3-hydroxybutyrate) (PHB) were measured by using a Fourier transform far-infrared spectrometer and a terahertz time domain spectrometer.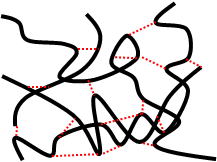 |
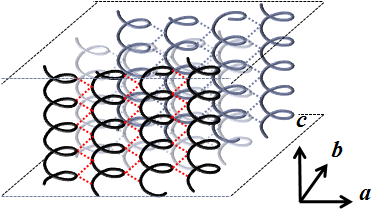 |
| Figure 1 Amorphous and lamellar structure of PHB Red lines show the hydrogen bonds. |
|
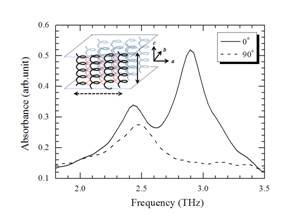 |
| Figure 2 Terahertz polarization spectra of PHB |
Figure 2 shows the absorption spectra of PHB stretched up to 1000%, in which the c axis of PHB is known to align in the direction of stretching. The spectra were measured by changing the angle between the stretching direction and the polarization of THz radiation. Of note is that the peak at 2.92 THz completely disappears when the electric fields of THz radiation is oriented perpendicular to the c axis, which means that the vibrational dipole transition moment of this peak must be oriented in the direction parallel to the c-axis. Most probably, this mode is a spring like motion of helical structure. On the other hand, the peak at 2.49 THz remains when the THz polarization is perpendicular to the c-axis. Given the fact that hydrogen bonding interaction in the PHB crystal lamellae exists along the a-axis, the peak around 2.49 THz may well be a vibrational mode due to the hydrogen bonding.
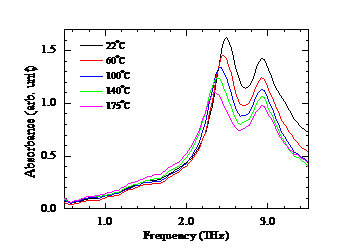 |
| Figure 3 Temperature dependence of the absorption spectra of PHB |
Two-dimensional correlation spectroscopy (2DCOS) in THz
We also applied THz spectroscopy for the analysis of polymer crystallization. A sheet of PHB was melted at 195C and then rapidly cooled down to the crystallization temperature (Tc). During the crystallization, THz absorption spectra were acquired continuously. Two-dimensional correlation spectroscopy (2DCOS) was applied for the obtained spectra. In the synchronous 2D, positive cross peaks were observed between the vibrational peaks due to lamellar crystal, and negative peaks were found between those of lamellar crystal and amorphous structure, which clearly shows that amorphous PHB changes to lamellar crystal (Figure 4 (a)). In the asynchronous plot, a cross peak was observed between 2.4 and 2.2 THz (Figure 4 (b)). The band widths of these peaks are broad (~0.2 THz) and difficult to resolve in the raw spectrum. However, in the asynchronous 2D, these two are clearly separated and show that the peak at 2.4 THz grows after that of 2.2 THz. Our previous studies concluded that the peak at 2.2 THz as the vibration of the helical structure, and that of 2.4 THz as the vibration between helical structures. The result of 2DCOS suggests that the formation of the helical structure is faster than that of the lamellar structure.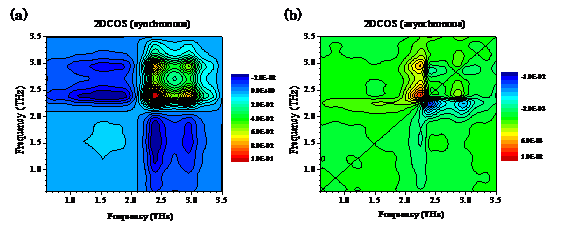 |
| Figure 4 Synchronous (a) and asynchronous (b) spectra of isothermal crystallization of PHB obtained by two-dimensional correlation spectroscopy. |
Papers
- Hiromichi Hoshina, Yusuke Morisawa, Harumi Sato, Hiroaki Minamide, Isao Noda, Yukihiro Ozaki, and Chiko Otani
"Polarization and temperature dependent spectra of poly(3-hydroxyalkanoate)s measured at terahertz frequencies"
Phys. Chem. Chem. Phys., 13 (20), 9173 – 9179 (2011) - Hiromichi Hoshina, Yusuke Morisawa , Harumi Sato , Akitsugu Kamiya , Isao Noda , Yukihiro Ozaki , Chiko Otani
"Higher order conformation of poly(3-hydroxyalkanoate)s studied by terahertz time-domain spectroscopy"
Applied Physics Letters, 96, 101904 (2010) - Hiromichi Hoshina, Shinya Ishii, Yusuke Morisawa, Harumi Sato, Yukihiro
Ozaki, and Chiko Otani
"Isothermal Crystallization of Poly(3-hydroxybutyrate) Studied by Terahertz Two-dimensional Correlation Spectroscopy"
Appl. Phys. Lett. submitted (2011)